|
Crude Oil, Gasoline and Natural Gas Futures
NYMEX Prices for October 6, 2008
| NYMEX Light Sweet Crude |
-6.07
|
$87.81
|
| IPE Brent |
-6.57
|
$83.68
|
| RBOB Gasoline NY Harbor |
-0.1600 |
$2.0675 |
| Heating Oil NY Harbor |
-0.1880
|
$2.4740 |
| NYMEX Natural Gas |
-0.523
|
$6.835
|
Graphs: Oil & Gas Spot and Futures prices
| Oil Price History and Analysis |
|
This page addresses the causes for OPEC's difficulties
and the 1997-1998 drop in crude oil prices and the cost and pricing problems faced by Independent Producers.
Update: OPEC fall 1999 meeting:
OPEC's balancing act and the impact of Y2K -9/21/99
Spring 1999 Market Share within OPEC One of the most frequent questions WTRG receives is "Why doesn't OPEC just cut production?
They will increase total revenue." This article explains one of the major problems OPEC faces each time it meets. The third
in a series on crude oil pricing issues.
More about crude oil prices and the impact of oil price changes
on various segments of the industry can be found at WTRG's Oil Price History Page. If you need help determining the impact of crude prices on your company please contact WTRG Economics. |
| OPEC's Failed Meeting: Price vs. Market Share
OPEC met November 25-26, 1998 in an attempt to reverse the decline in oil
prices. This meeting was a total failure for OPEC. They even failed to extend the current quotas past the June
1999 expiration date. The only point of agreement was to hold another meeting in March, 1999.
A year earlier OPEC had another failure when it approved a 10 percent quota
increase at a time when the Asian economies were entering a prolonged slump. As a result OPEC is experiencing the lowest prices
for crude oil, after adjusting for inflation, since the pre-Embargo days of 1972.
|
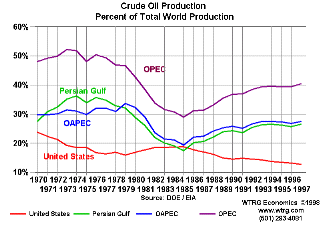
| Market share and price are recurring themes at OPEC meetings are . It is
easy to see why OPEC has been concerned about market share. In 1973, the year of the Arab Oil Embargo, OPEC's share
of the market was over 50 percent of world oil production. The oil price increases of the rest of the 1970s encouraged greater
levels of production in non-OPEC countries. It also resulted in reduced demand for crude oil as consumers increased insulation
in their homes and improved the energy efficiency of factories and automobiles. For several years world consumption declined.
In an attempt to maintain prices OPEC lowered production. The cuts were not deep enough. Prices continued to decline
and, as a result of lower consumption and increased non-OPEC production, the market share for OPEC dipped below 30 percent
by 1985. |
Crude Oil Production - OPEC Market Share
 Click on graph for larger view Click on graph for larger view |
| During the first half of the 1980's, Saudi Arabia disproportionately
reduced its output in an attempt to achieve OPEC's price goals. Throughout that same time period other OPEC members continually
cheated on their agreements. Finally in 1986 the Saudis opened the valves. Prices crashed and market share began to
increase for OPEC. By 1994 OPEC had recovered half of its lost market share. Since that date, the cartel has maintained a
market share of approximately 40 percent. |
Crude Oil Production: World

Click on graph for larger view |
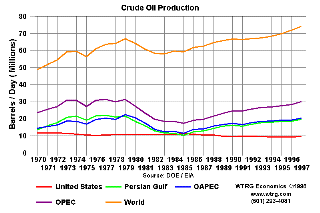
| The battle that OPEC faces is market share vs. price. The problem is that
you cannot have both. To increase market share you must increase production sufficiently to drive prices down to the point
that it is not economical for non-OPEC producers to maintain current production rates. Unfortunately for OPEC the full realization
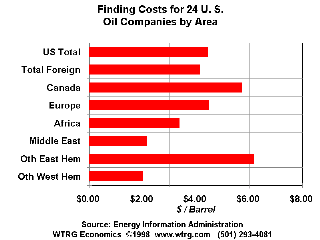
of the impact of lower prices on non-OPEC producers takes several years. The effect of lower prices is greatest in countries
and areas with the highest finding and production costs. Onshore production in areas with high lifting cost are usually the
first to show reduction in activity. Because of long term decisions involved, offshore producers often take longer to
react to lower prices. . |
Crude Oil Finding Costs

Click on graph for larger view |
| The battle for market share has caused problems within OPEC. The Saudis
want to have high export levels to the United States for all of the obvious reasons. Venezuela wants to increase prices by
reducing quotas again, but Venezuela is currently producing well above its current quota. Iran wants to reduce production,
but claims that its base for reduction is its former quota rather than its production levels at the time of the agreement.
The Saudis won't budge until everyone is in compliance with the agreement.
Saudi Arabia has not forgotten the cost in loss of market share in the first
half of the 1980s. As a consequence, the Saudis, Venezuela and Iran are temporarily locked in a battle that will leave all
OPEC countries short on cash for at least a few more months.
Perhaps the best chance for OPEC is a cold winter in the short term and
a rapid Asian recovery in the longer term. It would not be the first time increased demand solved OPEC problems. Maybe it
will again.
November 30, 1998 |
Lifting Costs

Click on graph for larger view |
The Independent Producers Dilemma
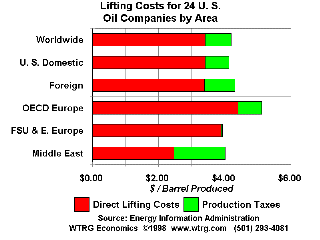
In the last update we discussed, among other things, lifting or production
costs and finding costs for various regions of the world. This issue will concentrate on the situations faced by U.S. producers.
In particular we will concentrate on the independent producer. For those of you not familiar with the term, independent
generally applies to a producer of oil or gas which does not also own downstream facilities such as refineries, gasoline or
diesel distribution, or retail stations.
That update pointed out that a survey of 24 of the larger U.S. oil companies
indicated that on the average it cost $4.48 to "find" a barrel of oil and $4.12 to produce it. That means there is no profit
for this group below $8.60 per barrel and no positive cash flow from operations below $4.12 per barrel.
Of course the average for these companies and the reality for many other
companies are quite different. Average production costs are just that - averages. Many oil fields have much higher costs.
In some cases, as much as four times the average.
I had a call a some time ago from a small independent producer who said
he could survive two more months at current prices. It has been two months. In another part of the U.S. another independent
had reduced its workforce by 20 percent and shut in 50 percent of its production. Any further reduction in production would
cause significant damage to the reservoirs. This company reduced lifting cost to $8.00 per barrel, but is only receiving an
average of $6.80 per barrel. How long can you stay in business losing $1.20 per barrel? As the operations manager for this
company stated, "It is very likely that we will see more independents sell out or close the doors soon."
Most people watch crude prices through the NYMEX or IPE window, but neither
the NYMEX price nor the IPE price is the price that producers receive. The price that a producer receives is heavily
influenced by location and quality, and in almost all cases the price is significantly less than the prices quoted on the
various exchanges.
To better understand the producers dilemma let's look at a year end snapshot.
On December 29th IPE February Brent closed at $10.61 and NYMEX February light crude closed at $11.70. On the same date
one of the major crude oil marketers was offering to purchase crude for as little as half that amount.
|
| The table shows some ranges for posted prices. We won't bore you with the
details of quality differences, but rather just give you the highs and the lows for several states. You should be aware that
posted prices vary from one purchaser to another and that the transaction price is subject to actual contract terms and additional
adjustments for quality.
To put these prices into more familiar terms. A crude oil producer on the
low end is receiving $4.65 per barrel or 11¢ per U.S. gallon. On the high end they received $9.00 per barrel or 21.4¢ per
gallon. Milk producers do much better than that and they don't have to pump their product thousands of feet to get it out
of the reservoir.
|
| Posted Prices |
| State |
Low |
High |
| COLORADO: |
7.85 |
8.00 |
| KANSAS: |
7.50 |
8.50 |
| LOUISIANA: |
6.50 |
8.75 |
| MISSISSIPPI: |
6.00 |
8.25 |
| NEBRASKA: |
7.35 |
7.75 |
| NORTH DAKOTA: |
4.65 |
7.90 |
| OKLAHOMA: |
6.00 |
9.00 |
| TEXAS: |
5.00 |
9.00 |
| WYOMING: |
5.50 |
8.50 | | |
The impact of low prices on the industry is significant.
By October, employment in oil and gas extraction was down 7.2 percent from 1997. Over the same period overall U.S. employment
was up 2.3 percent. That is a rate gap of almost 10 percent. When the data comes in for the rest of the year the rate
gap will widen. It would be even more extreme if the statistics could isolate oil extraction from natural gas extraction.
In many companies gas has been subsidizing oil and gas isn't doing all that well.
Companies have been laying off less experienced lower paid workers, but
the cuts are now moving up the experience ladder. If prices do not recover soon the industry will lose valuable human capital.
Thus the producers dilemma: lose talent, lose reservoirs or lose the business? In many cases, it will be all three.
January 29, 1999 |
More about crude oil prices and the impact of oil price changes on various
segments of the industry can be found at WTRG's Oil Price History Page. |
[WTRG's HOME PAGE]
Copyright © 1998
by James L. Williams
|
|
Address your inquiries to:
James L. Williams
WTRG Economics
P.O. Box 250
London, Arkansas 72847
Phone: (501) 293-4081
Email wtrg@wtrg.com |
Enter subhead content here
|

